Spruce budworm population behaviour

This is a research project done by me and submitted as a part of an assignment.

Reference usage only.

Abstract

Spruce budworm’s population dynamics are observed and recorded in recent decades, and the mathematical model describing the population of the budworm is fitted and its features are highly related to budworm’s real-life population behaviours and thus have great biological significance in forest protection and pest prevention.

A homogeneous budworm model is studied in the first section. It gives the bifurcations and conditions for the stability. The periodic transfer between two population levels and time evolution path are studied.

With diffusion considered, the spatial model in one dimension is given with varies conditions and their corresponding situation for the budworms. Biological waves are also studied.

Introduction

Spruce budworms’ behaviour represents one classic biological model in the diverse ecosystem, in which the populations of species are usually described by differential equation. The spruce budworm is studied as it destroys forest and break ecosystem balance.

In this mathematical model, with birds’ and other creatures’ predation considered, the partial differential equation described a population dynamic with interesting behaviours, which have realistic significance and explains what have been observed in real-life forest1. The number of budworms can be steady at different levels, which correspond to the steady states of the equations.
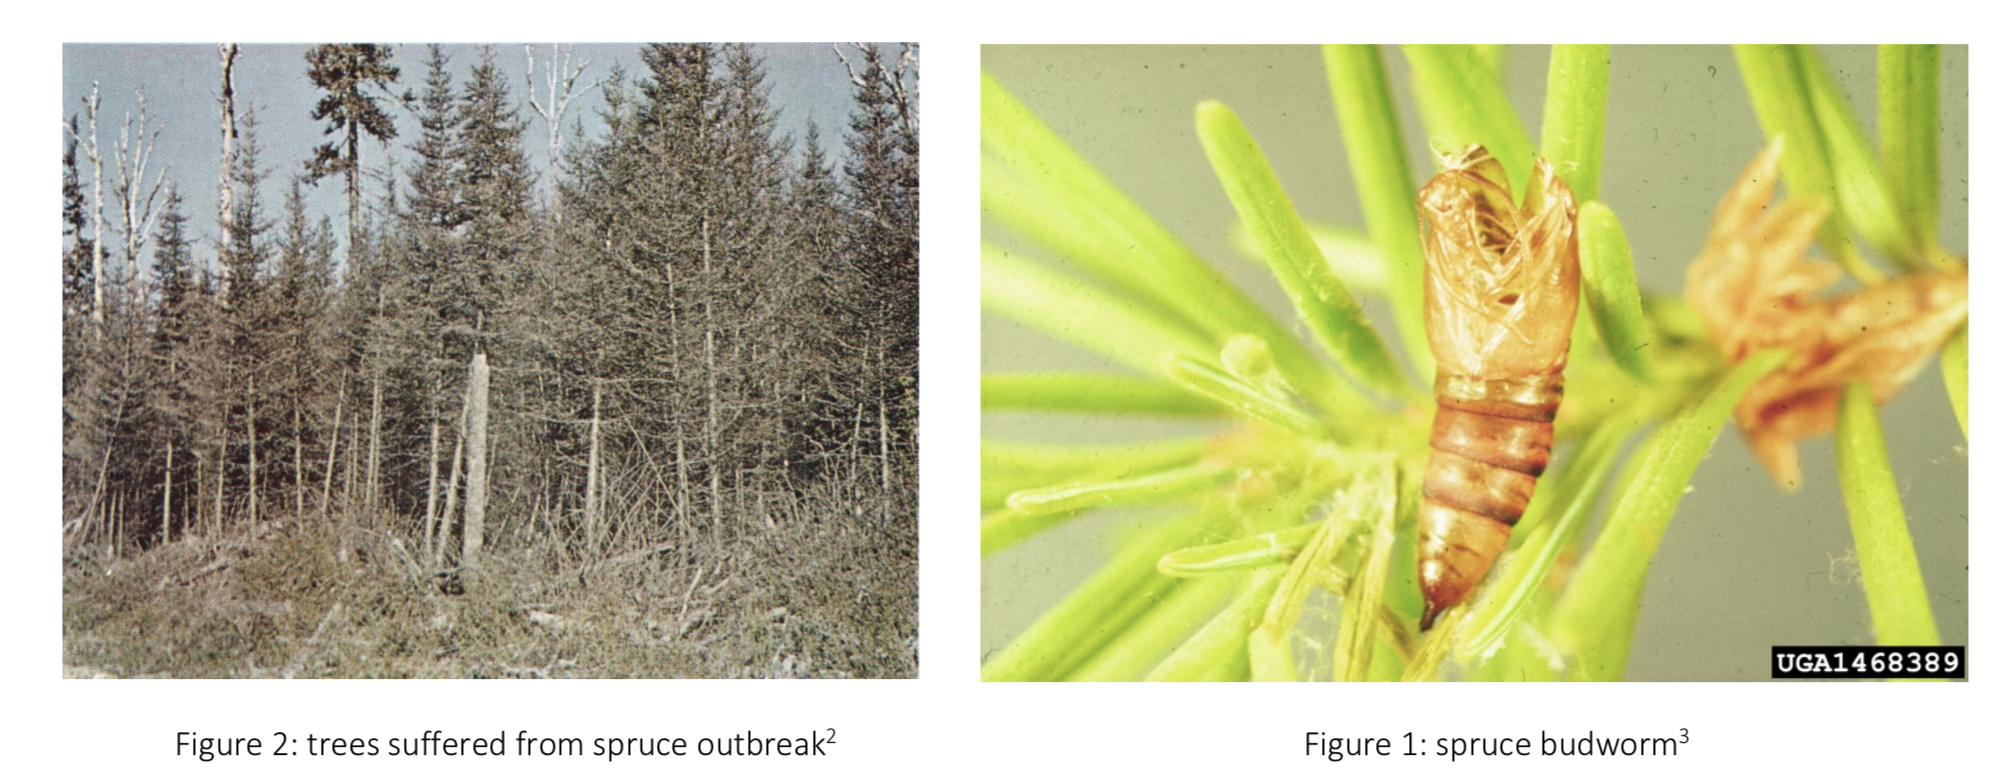
The number of spruce budworms remains at a low level (known as refuge level) for most of time, but it would see an outbreak and reach at a higher level (outbreak level) with catastrophic effects on forest. This periodic transfer between the two levels are motivated by the external changes e.g. living environment, and as a result, the carrying capacity varies with the spruce budworm population. Once the environment could afford a larger population, the refuge level becomes unstable and grows to an outbreak level, at which the budworms’ activities destroy forest (figure 1) and in return, turn down the environment capacity, thus the system cannot support such number of budworms and the population would drop to the relative less-harmful refuge level.

This game between the budworms and forest also involves spatial diffusion. As the budworms are distributed among the forest, a dynamic density distribution is observed, where the diffusion of population concentration and biological waves are shown.

The dynamics rises awareness of protecting the forest and pest control with the aim to avoid outbreak level. The dynamics and behaviours of budworm population can be described with differential equations, and PDE behaviours correspond to different population states, thus studying on the mathematical model would help us in predicting the forward trend of the budworms and apply pest prevention in advance.

Homogeneous budworm model

The population of the homogeneous spruce budworm can be modelled as

$d\ u(t)/dt=ru(1-u/q)-u^2/(1+u^2\ )=f(u)$

It is a variant of the continuous logistic population model with the predation term $u^2 /(1+u^2 )$ and model parameters r and q. r is the low-density growth rate; p is the environment carrying capacity. The predation term $u^2/\left(1+u^2\right)$ in the case is due to predatory birds which cause molality of the population. The term is formulated as $u^2/\left(1+u^2\right)$ to represent a fast-growing predation for u in low levels followed by slow growing for u in high levels. The predation is slowed down due to large population of budworms, as birds cannot eat any more when reaching their feed limit. For this ordinary differential equation, mathematical biology methods are implemented to analyse the behaviour of the system and the biological significance.

Steady states and their stability

The steady states $u^\ast$ can be obtained by solving

$ru^\ast\left(1-\frac{u^\ast}{q}\right)-\frac{u^{\ast2}}{1+u^{\ast2}}=0$

$\Longrightarrow u_1^\ast=0;or\ \frac{u^\ast}{1+u^{\ast2}}=r\left(1-\frac{u}{q}\right)$

The second case comes with a cubic equation, which could have zero, one two or three roots depending on the parameters. The analytic solution is too complex to present here. These steady states can be demonstrated from the graph below.

The stability can either be determine from the graph by tangent lines or the sign of $f^\prime\left(u\right)$.

  • Case 1: denote the roots of $f\left(u\right)=0$ as $x_0,\ x_1,\ x_2,\ x_3$ (ascending order)​. The second and forth steady states $x_1$ and $x_3$ are stable, i.e. $f\left(x_1\right)<0,\ f\left(x_3\right)<0$. $x_0$ and $x_2$ are unstable.

  • Case 2: denote the roots of $f\left(u\right)=0$ as $x_0,\ x_1 (ascending order)$. $x_0$ is unstable; $x_1$ is stable.

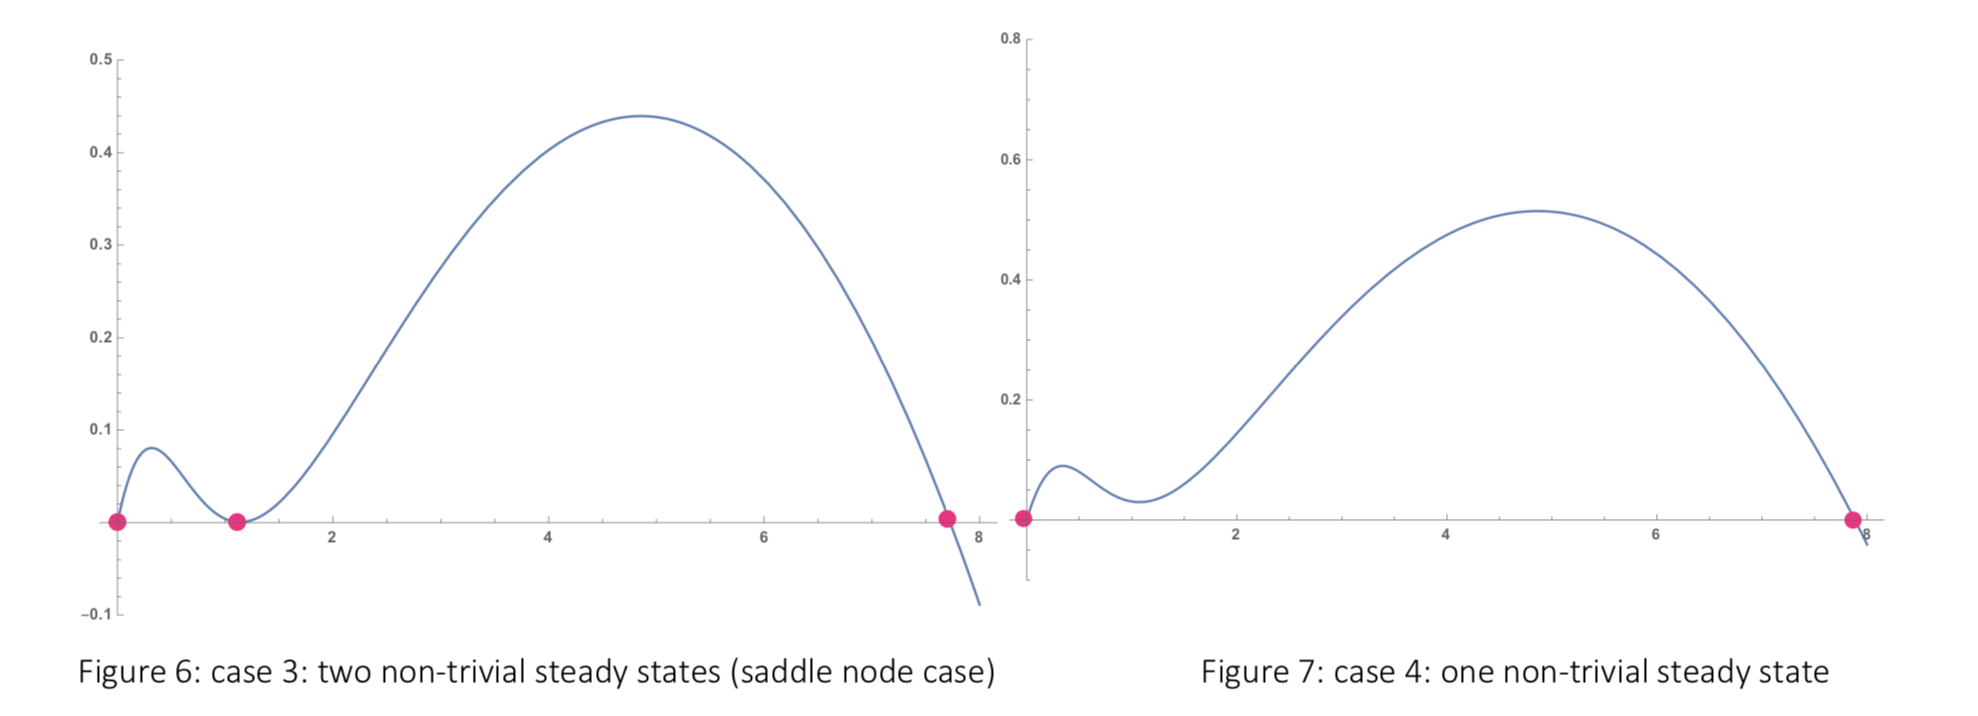
  • Case 3: denote the roots of $f\left(u\right)=0$ as $x_0,\ x_1,\ x_2$ (ascending order). $x_0$ is unstable; $x_2$ is stable. This case is representing bifurcation point, or saddle node. If the initial point is placed at x_1,then the population would stay at this point unchanged as time grows; if the initial point is a little away from x_1, i.e. $x_1+\delta$ or $x_1-\delta$ where $\delta$ small, then the population would not stable at $x_1$ but grow and stable at $x_2$. Further discussion is in the section Time evolution of the population. There is another case comes with two non-trivial steady states, which is discussed in the later section.

  • Case 4: denote the roots of $f\left(u\right)=0$ as $x_0,\ x_1$ (ascending order). $x_0$ is unstable; $x_1$ is stable.

The time evolution of these four cases is discussed in later section, with different staring points considered.

Bifurcations and tangency condition

Case 3 is a state between case 1 (three non-trivial steady states) and case 4 (one non-trivial steady states). While one of the parameters r, q is fixed and the other varies, there is a changing point where the number of non-trivial steady states reduce to 1 from 3, or increase to 3 from 1.

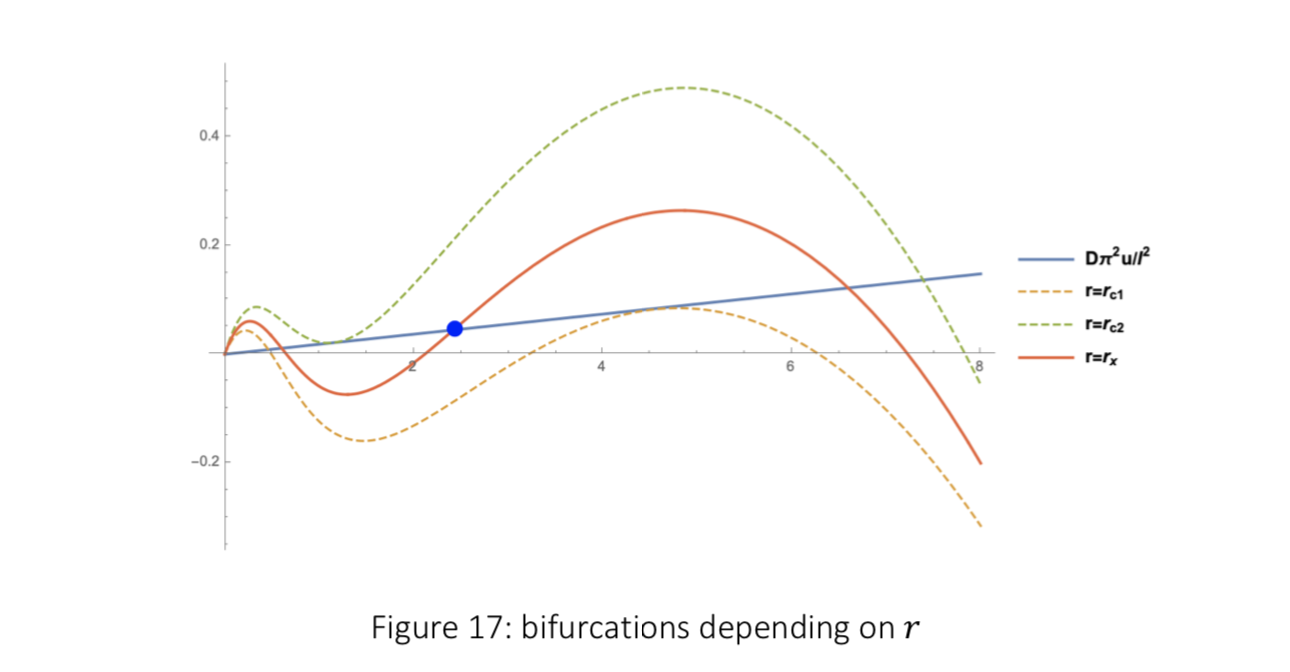
Suppose q is set to 10 and r changes, the plot of $f\left(u\right)$ is shown below.
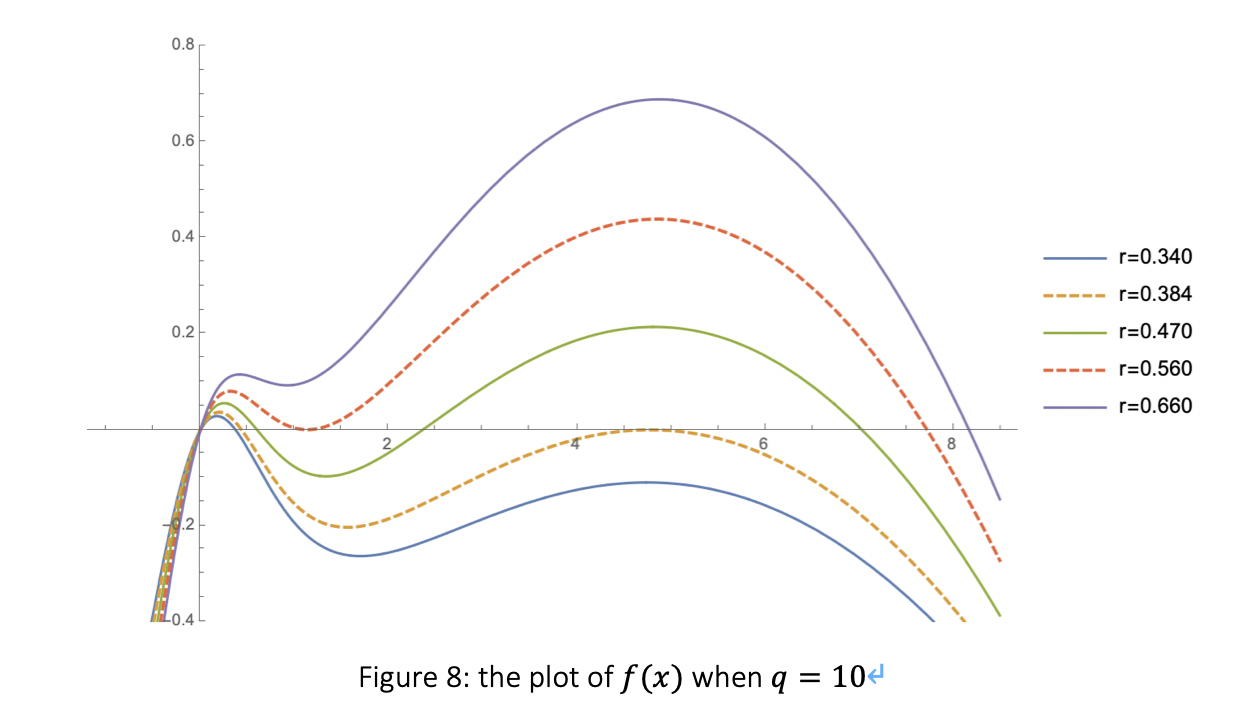
As dashed line indicates, there are two cases where part of the curve is tangent to the x-axis. When r increase from 0.340 to 0.660, the changes of the number of non-trivial steady states is

$$1\rightarrow_{(r=0.385)}3\rightarrow_{r=(0.565)}1$$

i.e. one steady state $x_1\longrightarrow$ tangent condition ($x_2$ appears and divided into two points) $\longrightarrow$ three steady states $x_1,\ x_2,\ x_3 \longrightarrow$ tangent condition ($x_1,\ x_2$ coalesce into one point and disappear) \longrightarrow one steady states $x_3$.

The tangent condition is given as $(u^\ast>0,\ r>0)$

$$f(u*)=0 AND f’(u*)=0$$

For q=10, we can find numerical solutions

The r values agrees with the plot above.
Generally, the tangent condition can be expressed by $r\left(x\right)$ and $q(x)$ by eliminating x:

The parametric plot of r against q is shown below (figure 9):

The coordinate plane is divided into two regions: Ⅰand Ⅱ (figure 10). Accord to this plot, the number of non-trivial steady states can be determined, i.e. the cusp condition:
If parameter r, q are fixed and $\left(q,\ r\right)$ lies in the region Ⅰ, then the model has only one non-trivial steady state; if $\left(q,\ r\right)$ lies in the region Ⅱ, then the model has three non-trivial steady states.
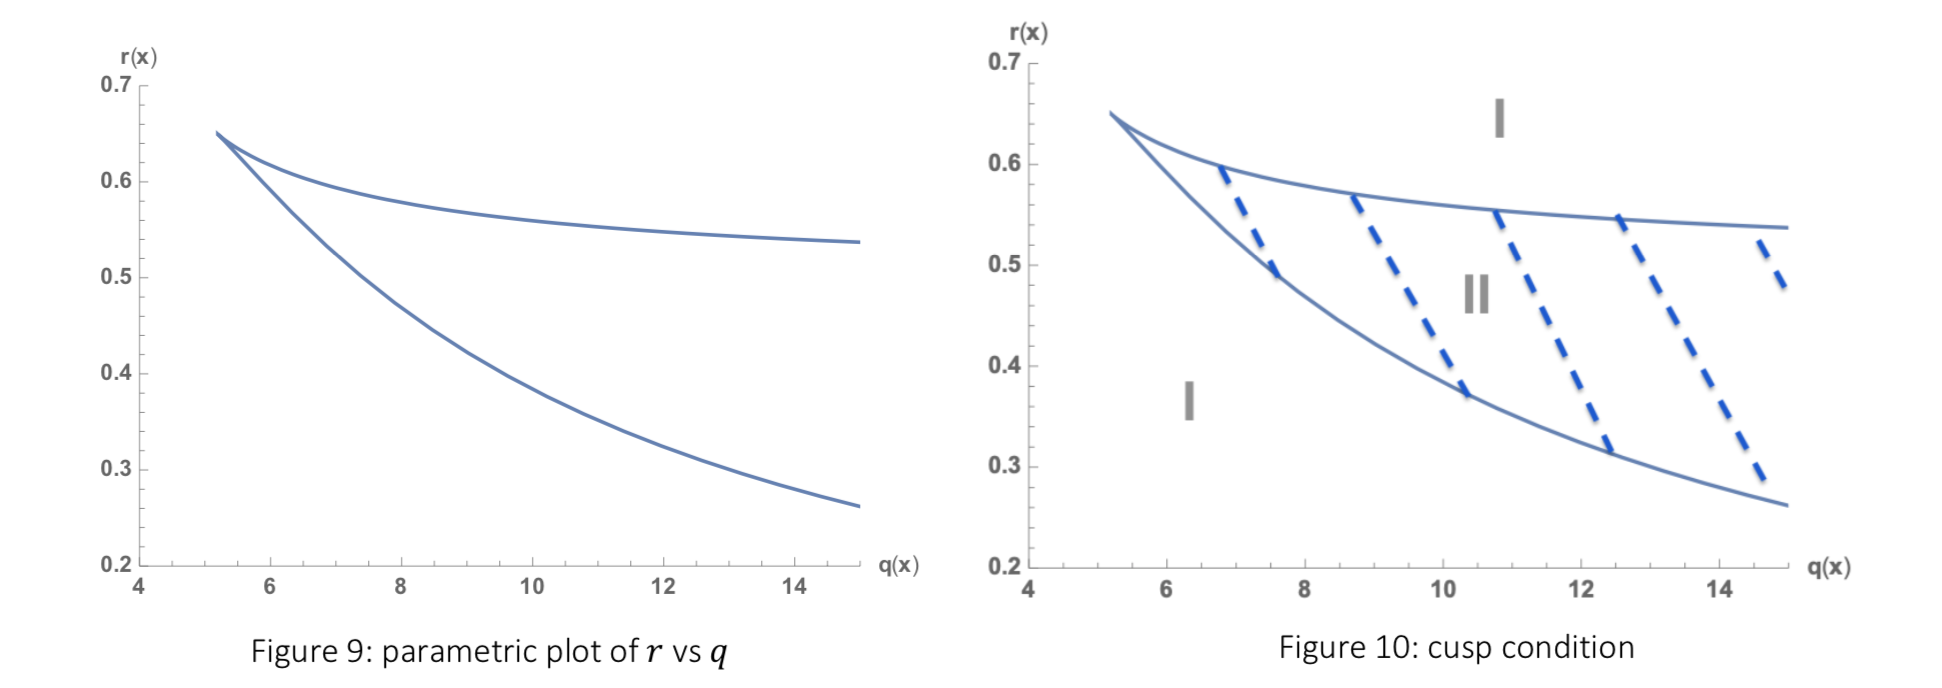
This condition also meets the example above, where q=10 and r increases from 0.340 to 0.660. Point $\left(10,\ r\right)$ lies in Ⅰ when r small, then in Ⅱ when r grows and finally in Ⅰ again, which agrees with the changes of the number of non-trivial steady states.

Time evolution of the population

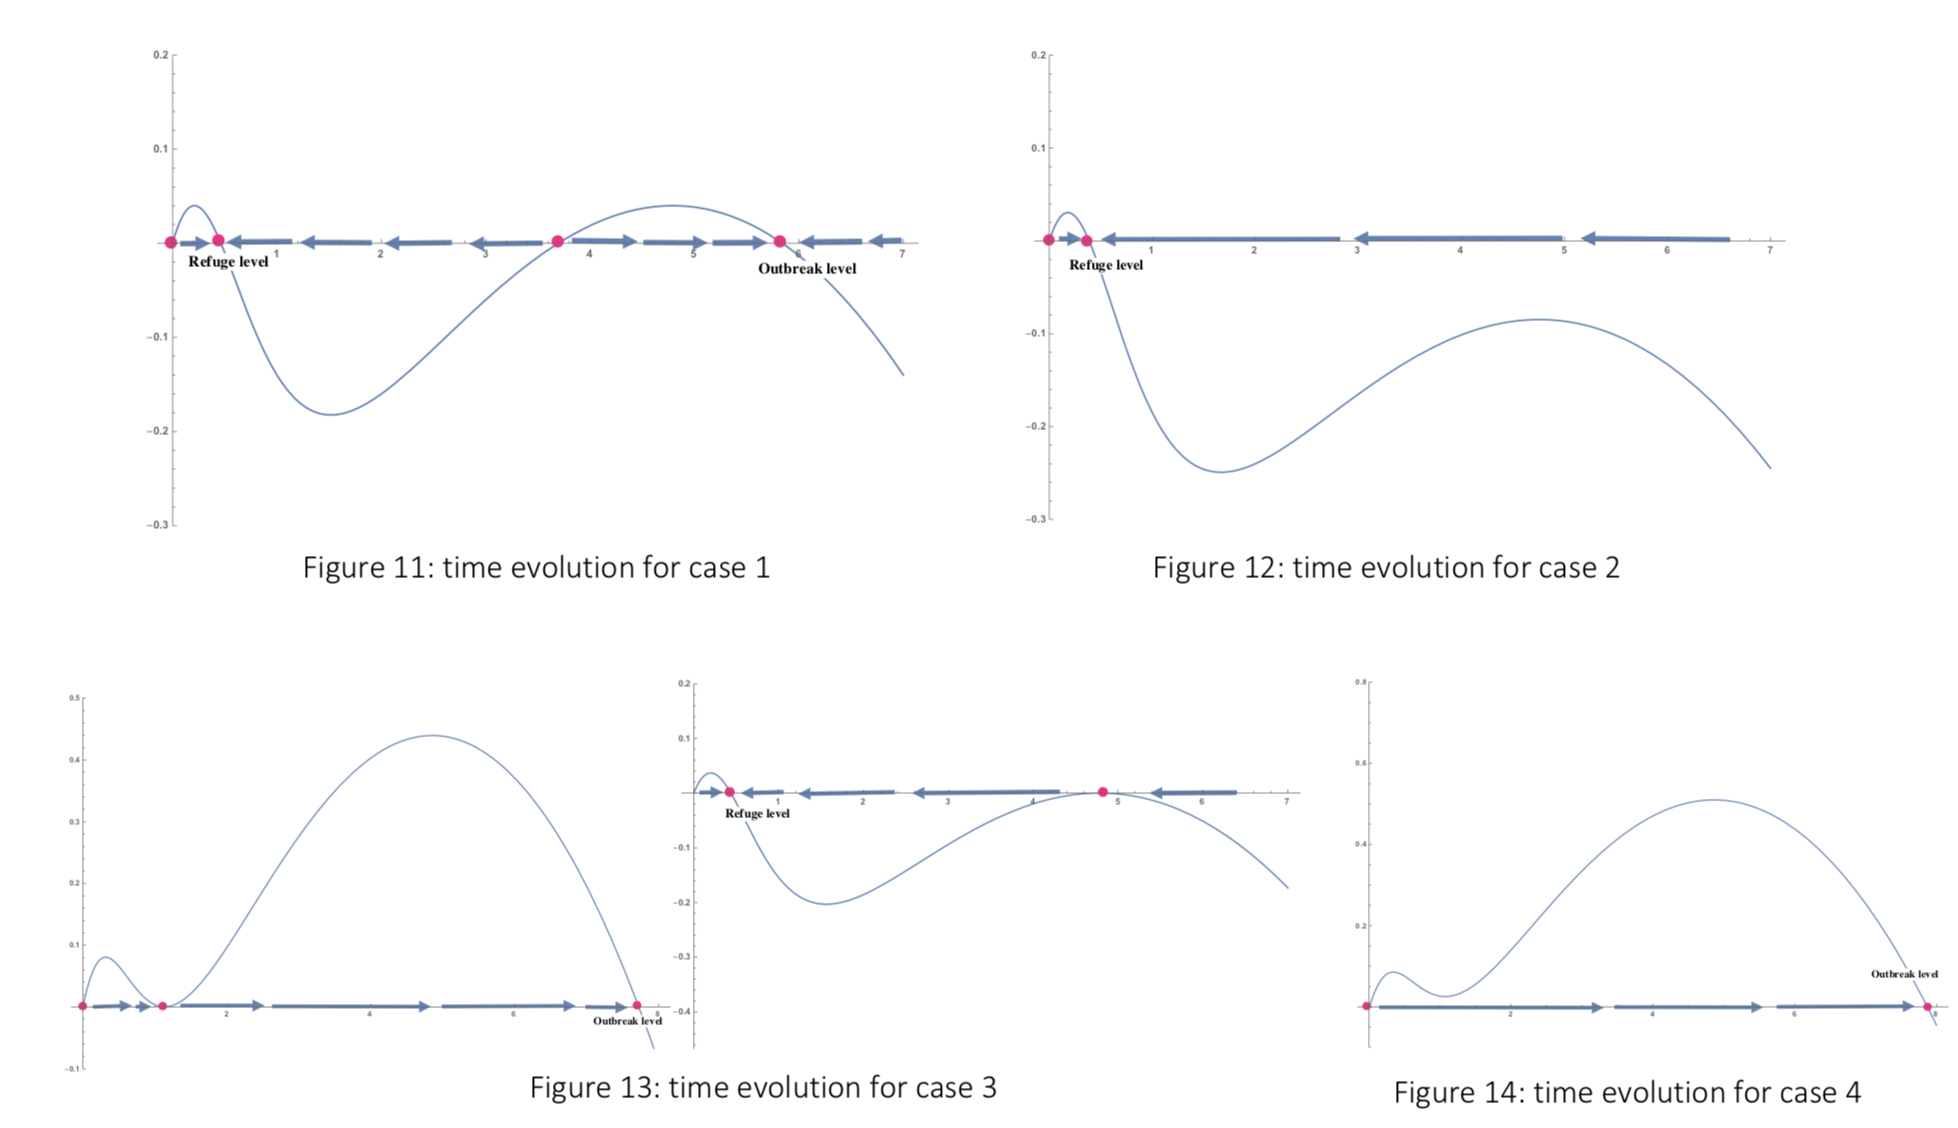
The time evolution or population trend can be visualized by the vector field on the x-axis. This evolution trend is validated in a programme.

  • Case 1: $x_1$ is refuge level, $x_3$ is the outbreak level. Different starting point will end up at different level. If initial point is at 0 or $x_2$, the population would stay unchanged (figure 11).
  • Case 2: there is only refuge level at $x_1$ (figure 12).
  • Case 3: this case represents two tangent conditions. The first one would see an outbreak level, while the second one would see a refuge level (figure 13).
  • Case 4: there is only outbreak level at $x_1$ (figure 14).

This cusp condition can be simplified, when one of the parameters is fixed. E.g. if r is fixed, then the behavior of the population is only determined by q. The exact solution for u and q of the differential equation can be extremely complex, but two critical values of q are in the solution, i.e. $q_{c1}$ and $q_{c2}$, corresponding to the boundary of the cusp line. $q<q_{c1}$ corresponds to case 2, $q>q_{c2}$ corresponds to case 4 and $q_{c1}<q<q_{c2}$ corresponds to case 1.
Evolution path

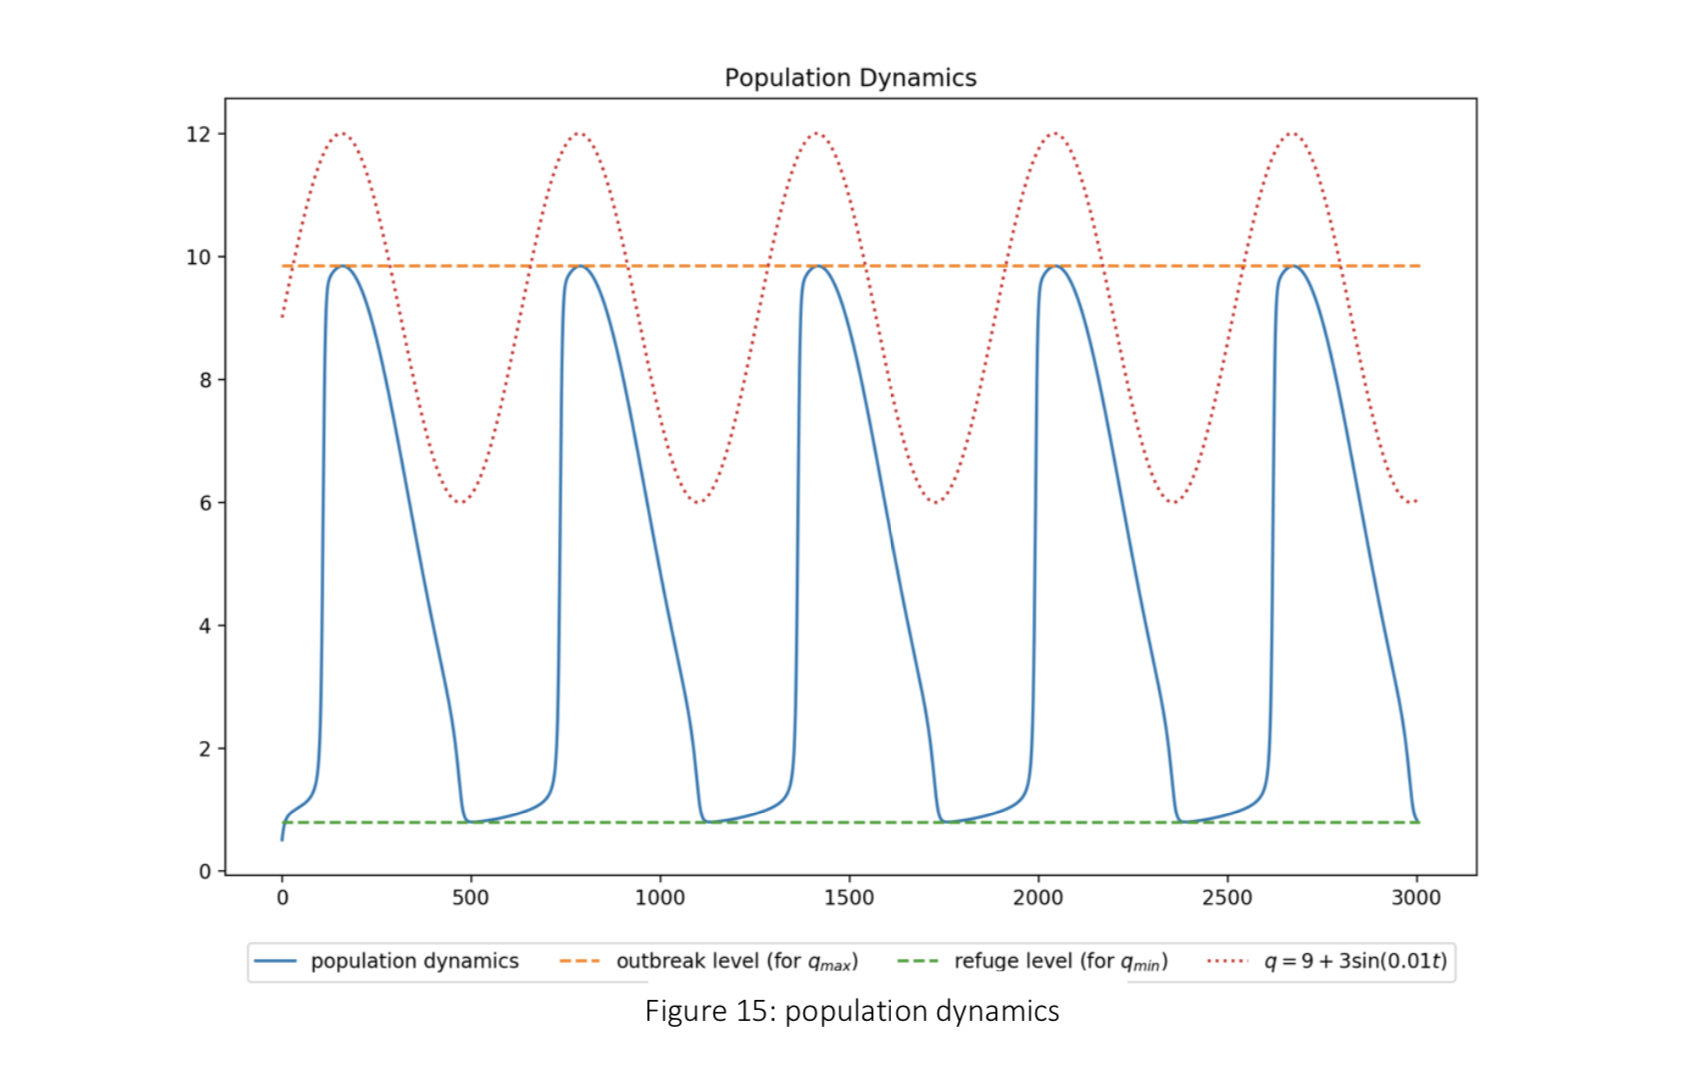
The budworm population can reach refuge level or outbreak level as time passes. In real-life, the budworm population can be catastrophic when at an equilibria of outbreak level, as the budworm may destroy the forest and break local ecological balance. It may happen that started in case 4, budworm population reaches outbreak level and result in carrying capacity q dropping to a level where only refuge level exists (i.e. case 2). Then the population will drop to the refuge level. Consequently, population in refuge level helps forest recover and q rises, followed by the same oscillations. In this case a hysteresis loop is obvious, where the path from outbreak level to refuge level and the return are not the same.

To simulating this, the q is set to be a function on time:

$$q=q_0+Q\sin(\omega t)$$

in this example, $q_0=9$,$\ Q=3$,$\omega=0.01$, and r=0.56 stays constant. Under this setting, $q_{max}=12$ with only outbreak level, $q_{min}=6$ with only refuge level. The dynamics of the system is shown in figure 15, where a hysteresis loop is visible.

The oscillation between outbreak and refuge mainly results from time-dependent q: it determines a jump between the two equilibria. The hysteresis tells that while forest destroyed, it is slow for species like budworm to develop firstly; also forest broken would cause instantly negative affect such that population would drop all the way to refuge level, where forest starts to recover.
Diffusion model

Let $R$ be the spatial coordinates of a reaction-diffusion species (in this case, the spruce budworm), the general spatial evolution of the species can be described as

$$\frac{\partial u\left({R},t\right)}{\partial t}=ru\left(1-\frac{u}{q}\right)-\frac{u^2}{1+u^2}+D\nabla^2u({R},t)$$

where the term f(u) explains the population dynamics, $D\nabla^2u({R},t)$ explained the spatial diffusion and D denotes the diffusion constant that marks the diffusion “speed” or “efficiency” in the space $R$.

Spatial behaviour and bifurcations

In one dimension (on a line $X$), the partial differential equation can be written as

$$\frac{\partial u}{\partial t}=ru\left(1-\frac{u}{q}\right)-\frac{u^2}{1+u^2}+D\frac{\partial^2u}{\partial x^2}$$

Under fixed boundary condition $(u\left(0,t\right)=u\left(l,t\right)=C$, $C$ constant), propose $u\left(x\right)=\sin(\pi x)$, then let $\frac{\partial u}{\partial t}=0$, we can find ($l$ is the length of the space ${X}$)

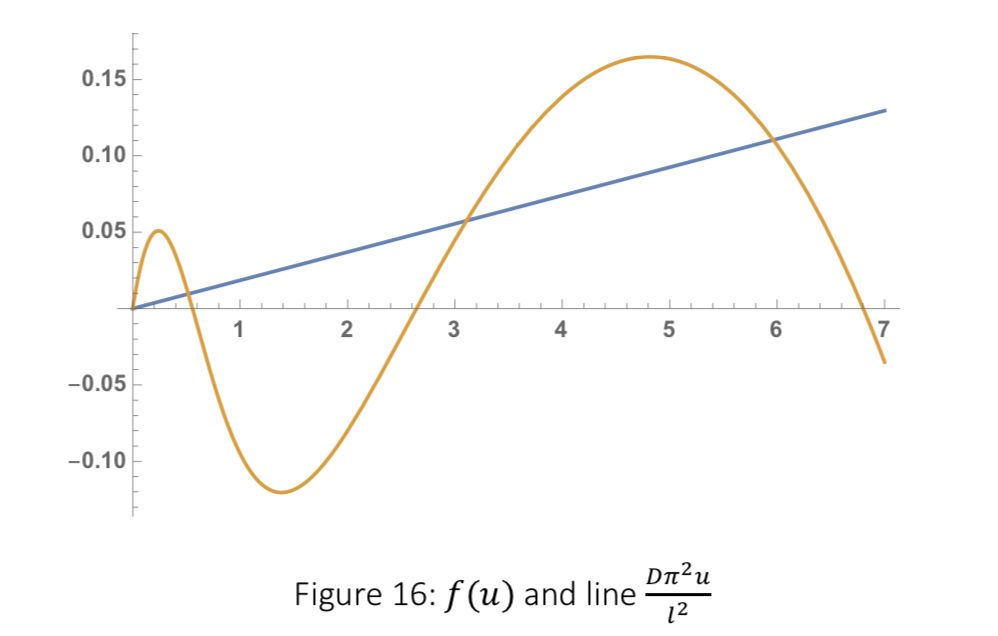
$$f\left(u\right)=\frac{D\pi^2u}{l^2}$$

Plot the curve of f(u) and line $\frac{D\pi^2u}{l^2}$ together, the intersections correspond to the root of the above equation:

The number of intersections can be 1, 2, or 3, and these cases have similar behaviour as discussed in the model without diffusion. In the model without diffusion the evolution is determined by the roots, i.e. the intersections of the curve f(u) and x-axis, but in diffusion model the evolution is determined by the intersections of the curve f(u) and line $D\pi^2u/l^2$. Similarly, there are also tangency condition and the bifurcations depending on it. The evolution treads also agree with the computer simulation of the partial differential equation, whose results are present later to demonstrate the bifurcation.

In the model without diffusion, the tangency condition is where part of the curve is tangent to the x-axis while in diffusion model, part of the curve is tangent to the line $D\pi^2u/l^2$:

While parameters q and D are fixed, the numerical solution can be found as pairs of $u^\ast$ and $r_c$. There are two non-trivial critical r values: $r_{c1}$ and $r_{c2}$, where $\ r_{c1}<r_{c2}$.

The bifurcation depending on r can be described as:

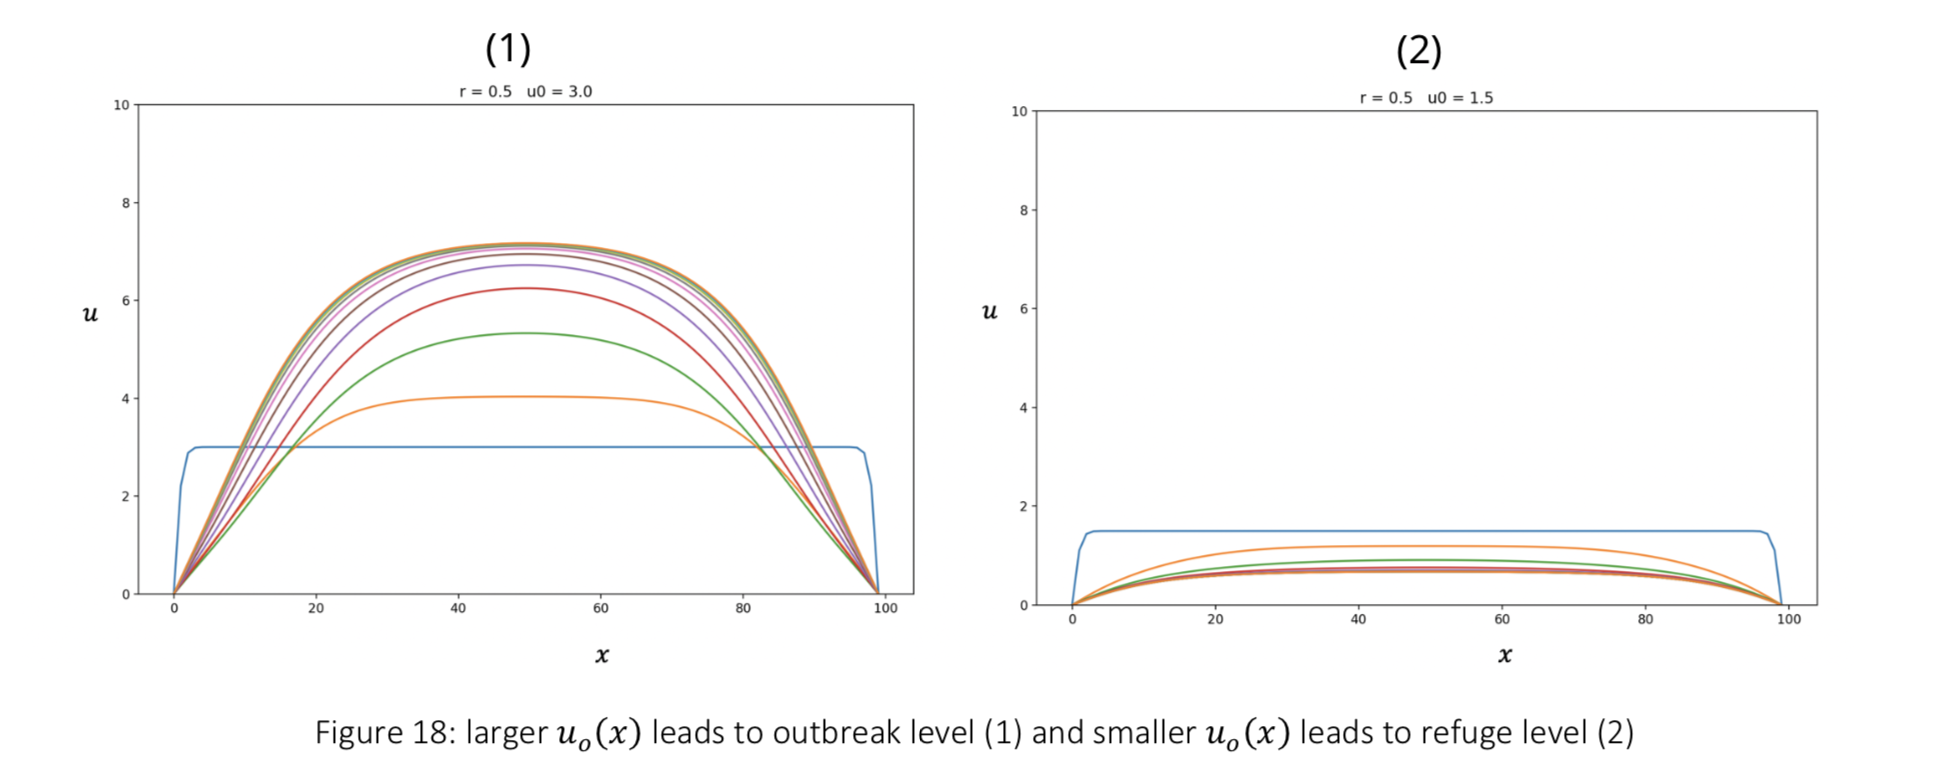
  • if $r<r_{c1}$, then the population would stable at a refuge level regardless of the initial distribution $u_0\left(x\right)$;
  • if $r_{c1}<r<r_{c2}$, then the population would stable at a refuge level for small $u_o(x)$, and at outbreak level for large $u_o(x)$. The dividing point of $u_o(x)$ is determined by the unstable root of the solution (the blue point in picture 16). This case is illustrated in figure 18.
  • if $r>r_{c2}$, then the population would stable at an outbreak level regardless of the initial distribution $u_0\left(x\right)$.

Wave

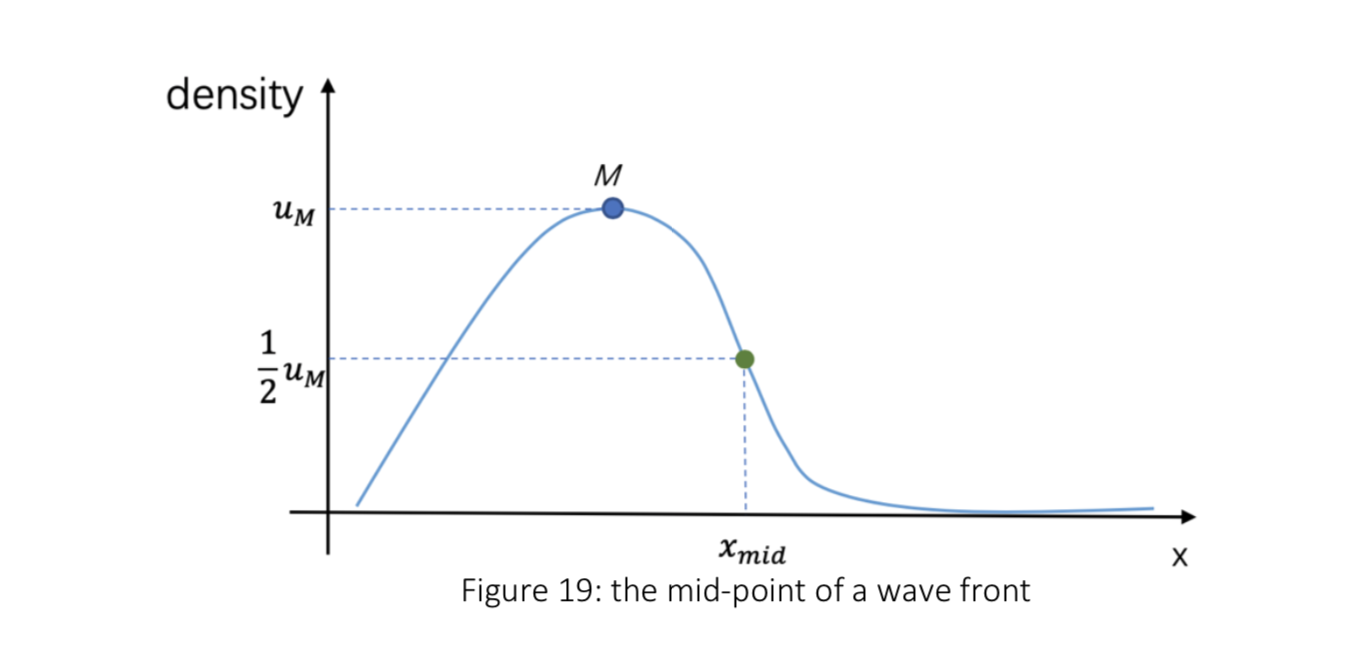
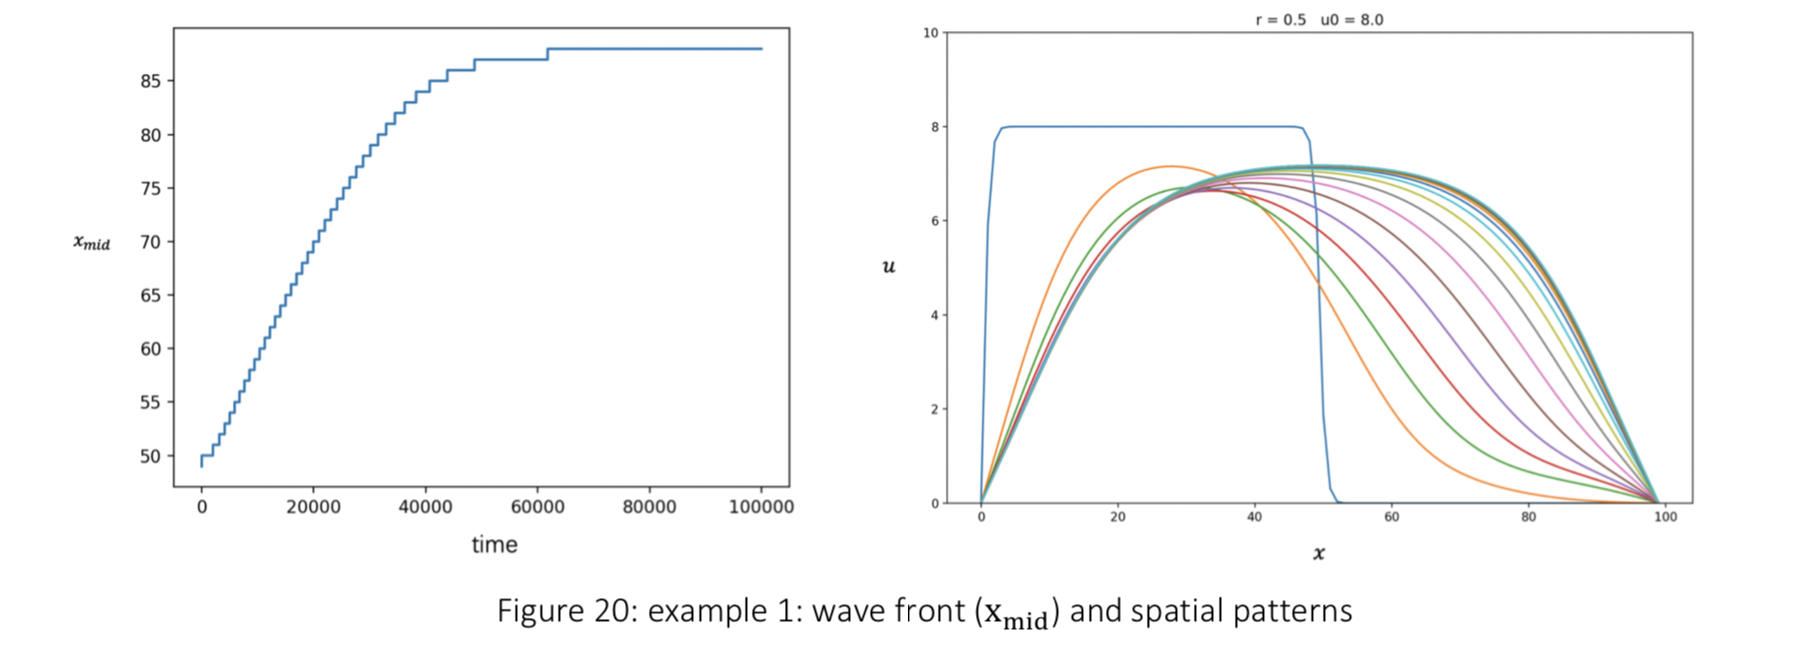
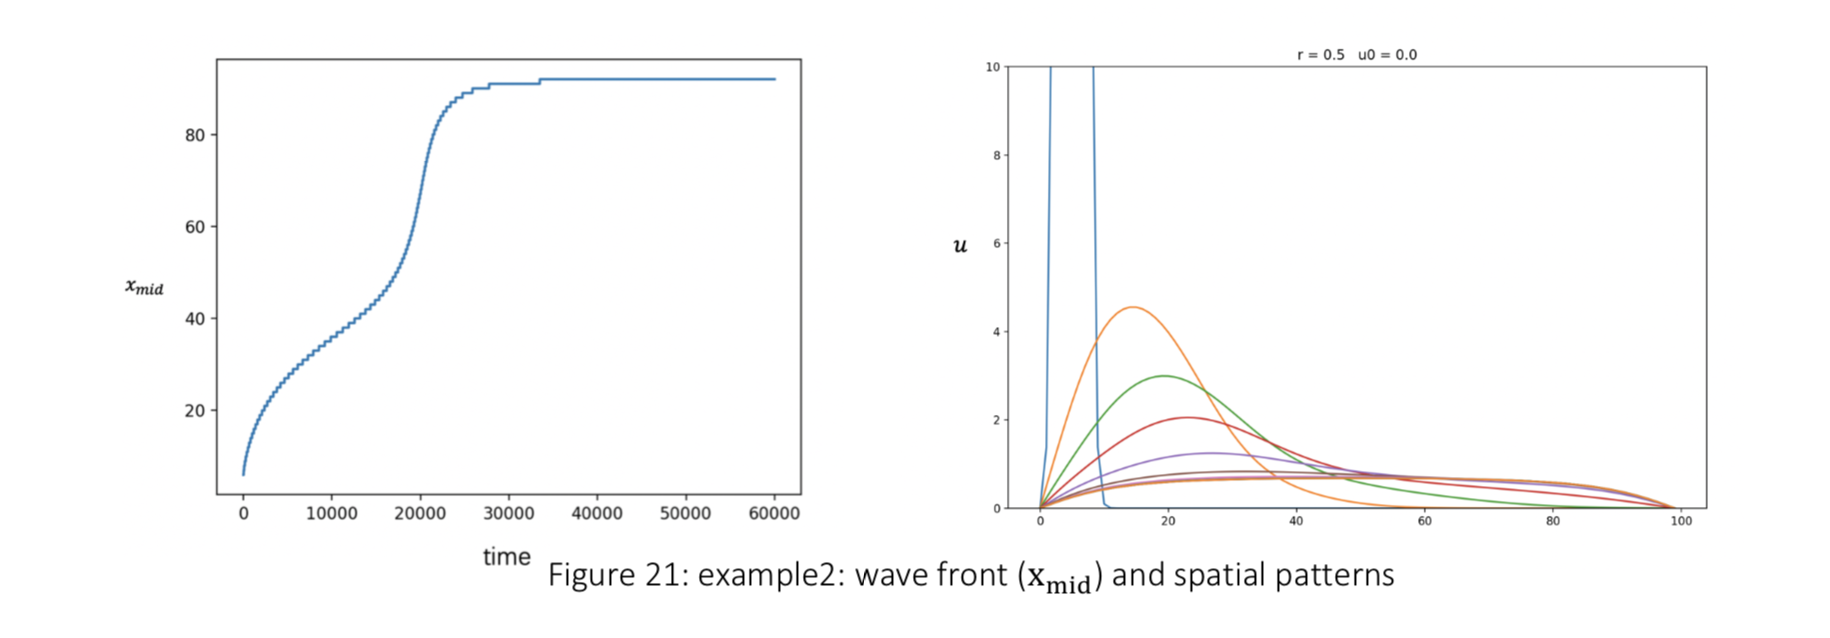
A diffusion wave could be observed when the initial distribution is properly placed in the space ${X}$. To study the movement of the wave, for each spatial state, denote the maxima as M, then the mid-point $x_{mid}$ depending on the height of the curve could be found on the wave front (figure 19).

The position of the $x_{mid}$ varies on time and could be used to represent the development of the wave front, i.e. measuring its velocity.

Examples

In these examples, $D=3,q=10,r=0.5,l=40$.

Example 1: the budworms are localised uniformly in the first half of the space, with initial values $u_0=8$ for $0\le x\le50$. Computer simulations give that the wave front moves nearly at a steady speed.
Example 2: the budworms are localised in a single point where $u_0=10,000$. The plot of wave front shows that high density in one point would see a rapid drop of population unstable wave developing speed.
Conclusions and outlook

Bifurcations and complex conditions arise when adding an extra term to the basic logic model. The equation for spruce budworm model has a special curve shape thus it has up to 3 solutions in certain condition. The complexity is shown in the evolution path when changing parameters.

The spatial behaviour is also model as an extension of the equation with diffusion term added, in this case the relationship between the line $y=D\pi^2u/l^2$ and the curve determines the spatial behaviours.
These models are helpful in predicting the forward movement of the budworm population, with parameters given.

However, the model cannot represent exactly the real-life dynamics and consider all the factors that influence the budworm. Also, the assumptions in the diffusion model that $u\left(x\right)\approx\sin(\pi x)$ is not the exact solution form, as the theoretical numerical solutions and conditions are not meet the computer simulation model which represents the exact situation of the equation.

Diffusions in higher dimensions have been studied with more complicated PDE method^4. The possible improvement of the model includes using the explicit environment system, or making corrections using real-life observations (e.g. adding another term to the equation to describe the system more specifically).

Reference

[1] Powell, Jerry A., ed. Biosystematic studies of conifer-feeding Choristoneura (Lepidoptera: Tortricidae) in the western United States. Vol. 115. Univ of California Press, 1995.

[2] Morris, R. F. (1963). The dynamics of epidemic spruce budworm populations. The Memoirs of the Entomological Society of Canada, 95(S31), 1-12.

[3] R. G. Van Driesche et al, Forest Pest Insects in North America: a Photographic Guide, https://www.forestpests.org/vd/index.html

[4] Singh, M., Easton, A., Cui, G., & Kozlova, I. (1998). NUMERICAL STUDY OF THE TWO‐DIMENSIONAL SPRUCE BUDWORM REACTION‐DIFFUSION EQUATION WITH DENSITY DEPENDENT DIFFUSION. Natural Resource Modeling, 11(2), 143-154.

Appendix

Python Code

homogenous model

1
2
3
4
5
6
7
8
9
10
11
12
13
14
15
16
17
18
19
20
21
22
23
24
25
26
27
28
29
30
31
32
33
34
35
36
37
38
39
40
41
42
43
44
45
46
# Population Dynamics, time evolution
# homogenous model

from scipy.integrate import ode
import matplotlib.pyplot as plt
import math
from numpy import *

x_list = []
y_list = []

# initial values: u0 and t0
y0, t0 = 0.5, 0
q_ini = 9 # initial values: q0
q = q_ini
q_list=[]

# integration:
def f(t, y):
return 0.56*y*(1-y/q)-y**2/(1+y**2)

r = ode(f)
r.set_initial_value(y0, t0)

t1 = 3000
dt = 0.1


while r.successful() and r.t < t1:
# print(r.t+dt, r.integrate(r.t+dt))
x_list.append(r.t+dt)
y_list.append(r.integrate(r.t+dt)[0])
q = q_ini+3*math.sin(0.01*(r.t+dt))
q_list.append(q)

# plot:
plt.plot(x_list, y_list,label= "population dynamics")

plt.plot(range(3010),[9.84581]*3010,linestyle= "--", label= r"outbreak level (for $q_{max}$)")
plt.plot(range(3010),[0.789337]*3010,linestyle= "--", label= r"refuge level (for $q_{min}$)")
plt.plot(x_list,q_list,linestyle=":",label= r"$q=9+3\sin (0.01t)$")
plt.legend(loc="lower center",bbox_to_anchor=(0.5, -0.15), ncol=4)
plt.title("Population Dynamics")

plt.show()

diffusion model, time evolution

1
2
3
4
5
6
7
8
9
10
11
12
13
14
15
16
17
18
19
20
21
22
23
24
25
26
27
28
29
30
31
32
33
34
35
36
37
38
39
40
41
42
43
44
45
46
47
48
49
50
51
52
53
54
55
56
# diffusion model, time evolution

import matplotlib.pyplot as plt
import numpy as np

# parameters:
D = 3
k = 10
r = 0.01
l = 40.

# integration setup:
N, M = 100, 100000
dX, dT = l/N, 0.001

B, E = r*dT, D*dT/(dX*dX)

u = np.zeros((100, M))
u_t = np.zeros(M)

# define initial distribution
for i in range(100):
u[i][0] = 5

# fixed BC:
for t in range(1, M):
#u[0][t] = u[0][0]
#u[N-1][t] = u[N-1][0]
u[0][t] = 0.
u[N-1][t] = 0.

#print(u)

for t in range(1, M):
u_t[t]=0
for x in range(1, N-1):
u[x][t] = u[x][t-1]+B*u[x][t-1]*(1-u[x][t-1]/k)+E*(u[x+1][t-1]-2*u[x][t-1]+u[x-1][t-1])
u_t[t]+=u[x][t]
# zero-flux BC:
#u[0][t]=u[1][t]
#u[N-1][t]=u[N-2][t]

# plot spatial patterns vs time:
plt.figure(10, figsize=(11, 7))
for t in range(20, M, 10000):
plt.plot(range(100), u[:, t], label = "%d" %t)
#plt.savefig("cp5/%d.png" %t)
#plt.legend(loc="best")
plt.ylim(0,10)

# plot total population vs time:
plt.figure()
plt.plot(range(2,M),u_t[2:])

plt.show()

diffusion model, wave front

1
2
3
4
5
6
7
8
9
10
11
12
13
14
15
16
17
18
19
20
21
22
23
24
25
26
27
28
29
30
31
32
33
34
35
36
37
38
39
40
41
42
43
44
45
46
47
48
49
50
51
52
53
54
55
56
57
58
59
60
61
62
63
64
65
66
67
68
69
70
71
72
73
74
75
76
77
78
79
80
81
82
83
84
# diffusion model, wave front

import matplotlib.pyplot as plt
import numpy as np

# parameters:
D = 3.
k = 10.
r = 0.5
l = 40.

# integration setup:
N, M = 100, 60000
dX, dT = l/N, 0.001

B, E = r*dT, D*dT/(dX*dX)

u = np.zeros((100, M))
u_t = np.zeros(M)


# define initial distributions:
for i in range(50): # distributed in the first half
u[i][0] = 8
#u[5][0]=10000 # distributed in a single point


# fixed BC:
for t in range(1, M):
#u[0][t] = u[0][0]
#u[N-1][t] = u[N-1][0]
u[0][t] = 0.
u[N-1][t] = 0.

#print(u)

for t in range(1, M):
u_t[t]=0
for x in range(1, N-1):
u[x][t] = u[x][t-1]+B*u[x][t-1]*(1-u[x][t-1]/k)-\
dT*(u[x][t-1]*u[x][t-1]/(1+u[x][t-1]*u[x][t-1]))+\
E*(u[x+1][t-1]-2*u[x][t-1]+u[x-1][t-1])
u_t[t]+=u[x][t]
# zero-flux BC:
#u[0][t]=u[1][t]
#u[N-1][t]=u[N-2][t]


# plot spatial patterns vs time:
plt.figure(10, figsize=(11, 7))
for t in range(20, M, 5000):
plt.plot(range(100), u[:, t], label = "%d" %t)
#plt.savefig("cp5/%d.png" %t)
#plt.legend(loc="best")
plt.title("r = " + str(r) + " u0 = " + str(u[0][0]))
plt.ylim(0,10)

# plot total population vs time:
plt.figure()
plt.plot(range(2,M),u_t[2:])
plt.title("r = " + str(r) + " u0 = " + str(u[0][0]))

#plt.show()

# mid-point setup:
midPt = []
maxXList = []
# calculate mid-point:
for t in range(1, M):
midPtY = u[:, t].max()/2
maxX = u[:, t].argmax()
maxXList.append(maxX)
newU = abs(u[maxX:, t]-midPtY)
misPtX = newU.argmin()+maxX
midPt.append(misPtX)

#print(midPt[0:100])
#print(maxXList[0:100])

# plot mid-point:
plt.figure()
plt.plot(range(1,M),midPt)
plt.show()